Skip to content
SubmittedScientific Data, Data Descriptor · 2026 · Sole author

ClinicalTensorSepsis

A harmonized multi-cohort temporal resource for Sepsis-3 research

Overview

Adult Sepsis-3 cohorts built from three critical-care databases through separate, source-specific pipelines and mapped to a common representation only where the source data support it. Differences in infection definitions, timing, and measurement evidence are kept visible rather than treated as equivalent.

Observed and reconstructed values are released separately. Hours after follow-up are distinguished from missing data, and every cell records whether it was observed, reconstructed by SAITS, forward filled, median filled, or left unfilled. A cross-database representation aligns CareVue and eICU to MIMIC-IV using clinically constrained optimal transport.

Sepsis-3 adjudication · Gap-aware SAITS · Temporal convolutional encoder · Unbalanced optimal transport · Docker

ICU stays
28,169
Sources
MIMIC-IV 3.1 · MIMIC-III CareVue 1.4 · eICU-CRD 2.0
Temporal grid
50 features × 24 onset-aligned hours
Release
Submitted to PhysioNet; code on GitHub

Figures
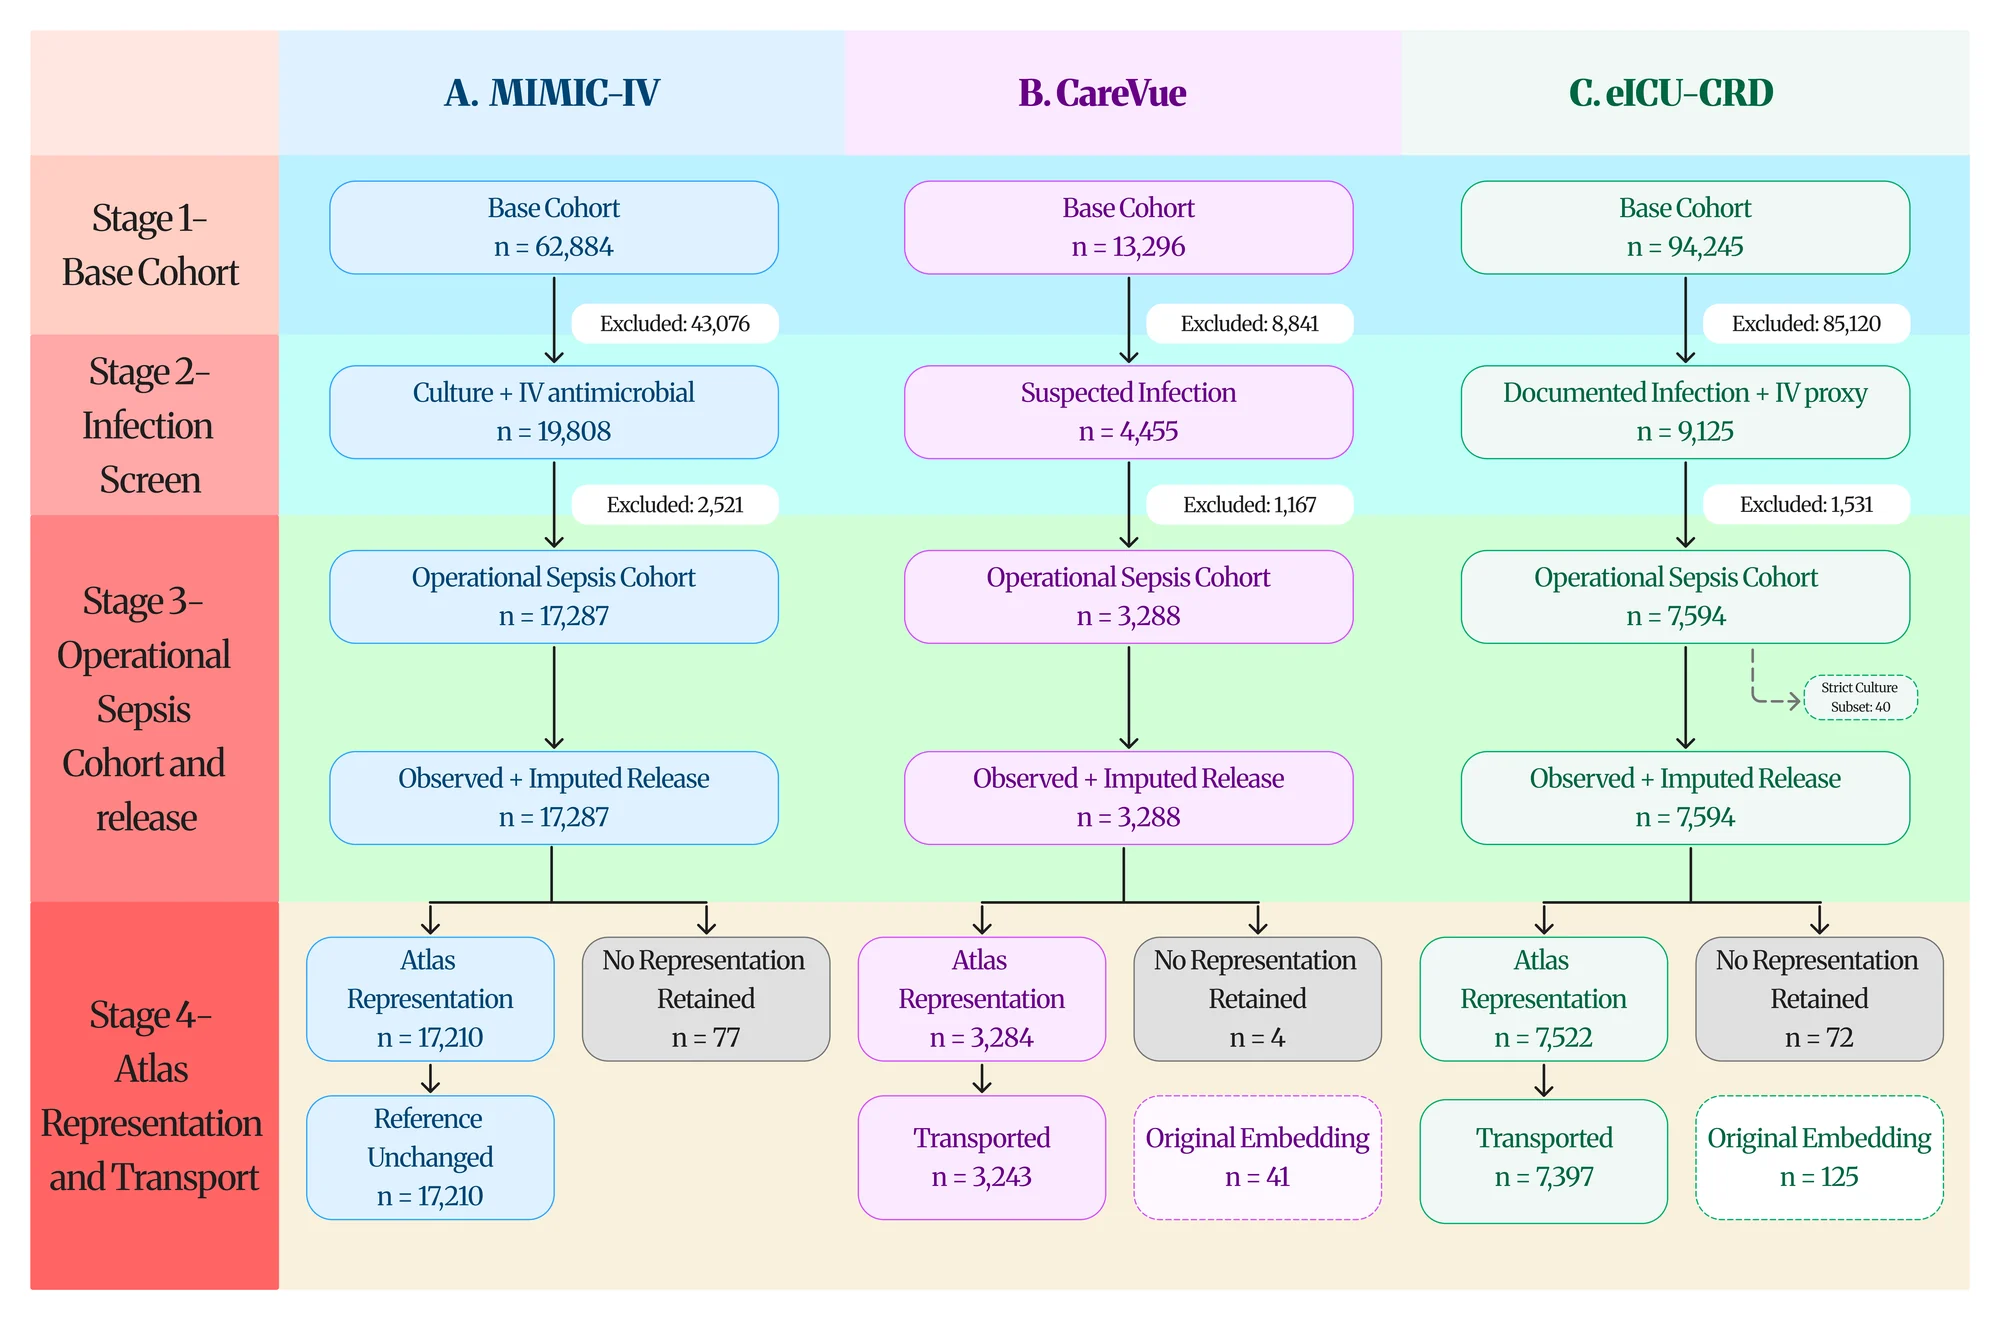
Flow diagram in three columns for MIMIC-IV, CareVue, and eICU-CRD, showing patient counts from base cohort through infection screening, operational Sepsis-3 cohort, release, and atlas representation.
Fig. 1. Cohort selection and representation retention. Each database is followed from base-cohort selection through infection screening, Sepsis-3 adjudication, temporal release, and atlas construction.
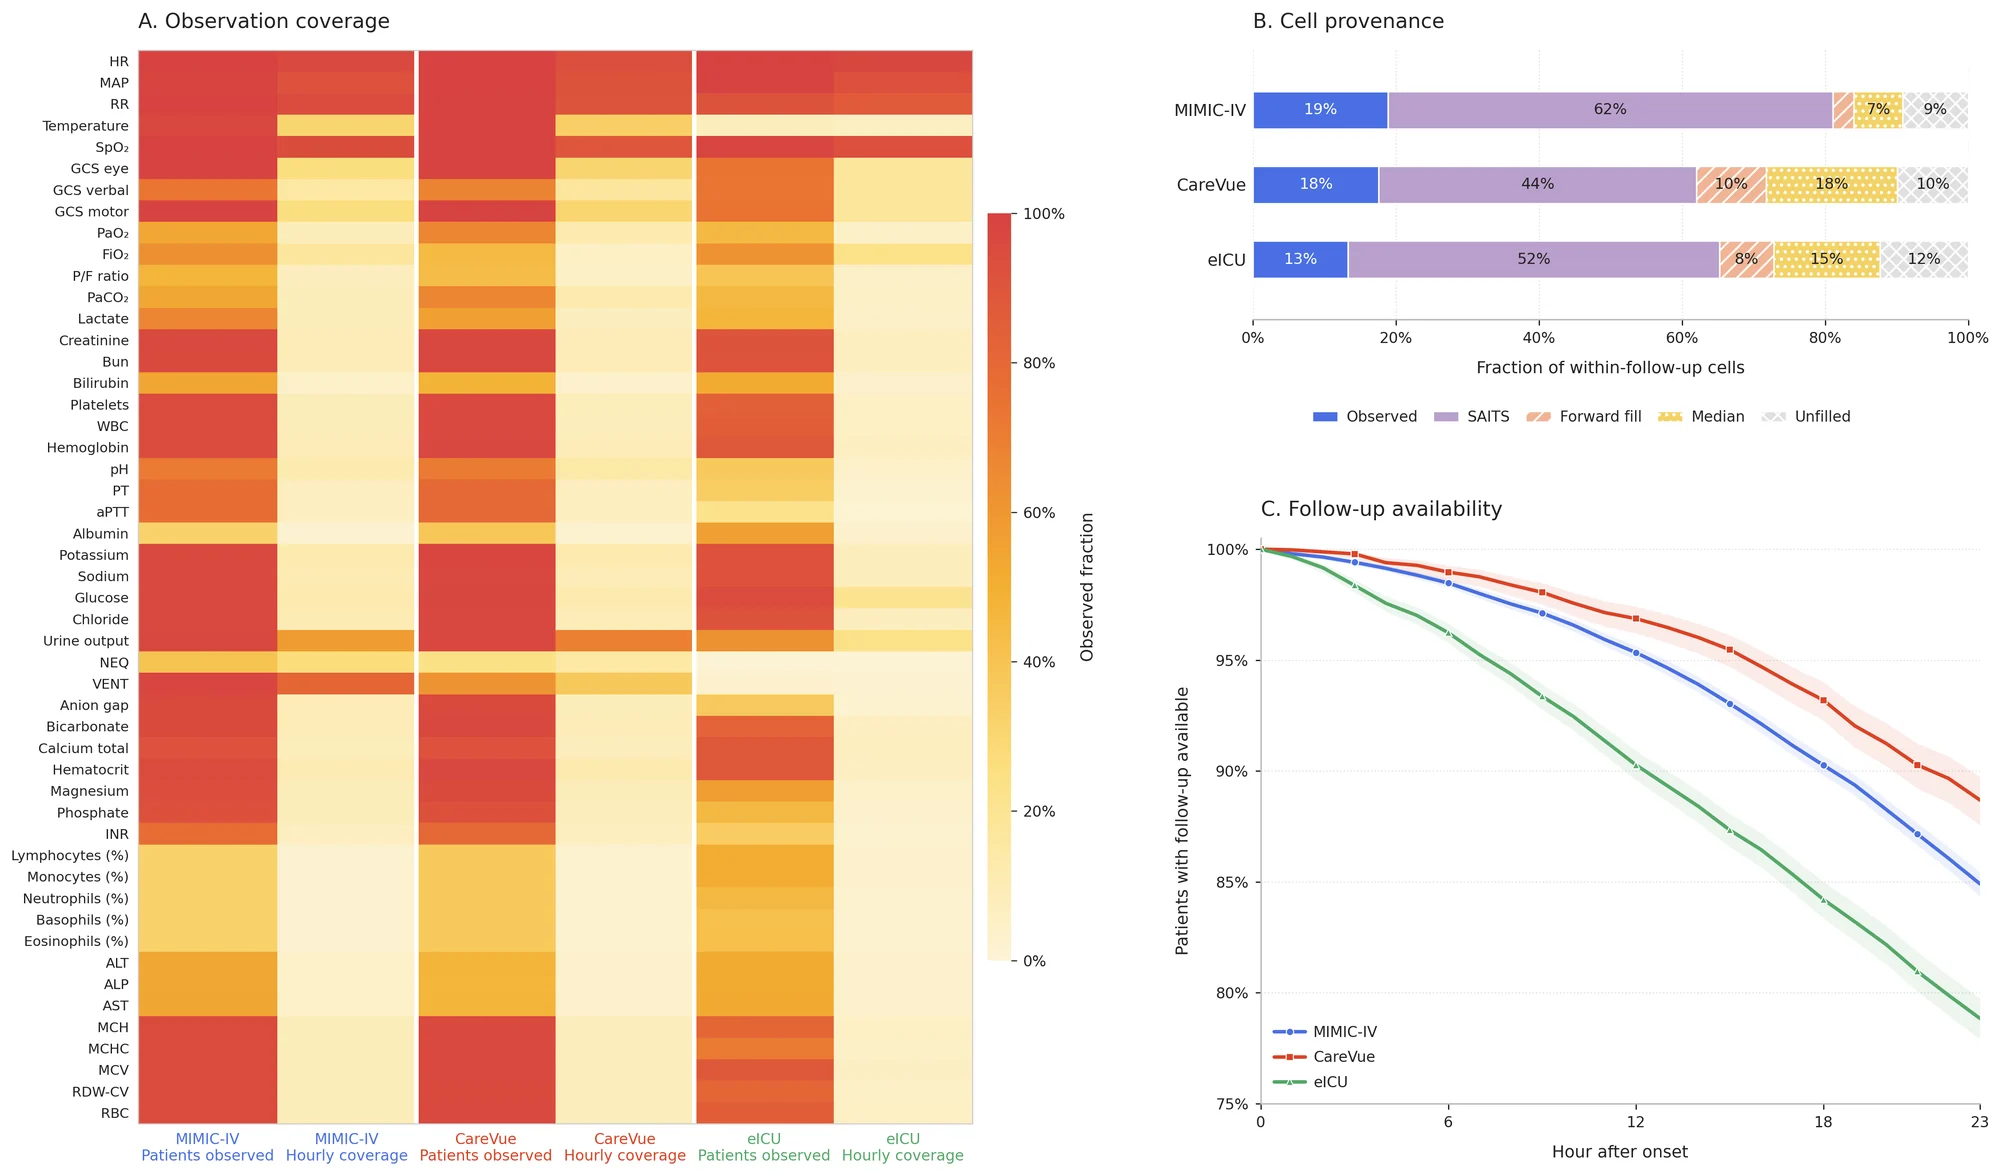
Heatmap of observation coverage for 50 clinical features in each database, stacked bars of cell provenance, and curves of follow-up availability over 24 hours.
Fig. 3. Observation coverage, value provenance, and follow-up availability across the three databases.
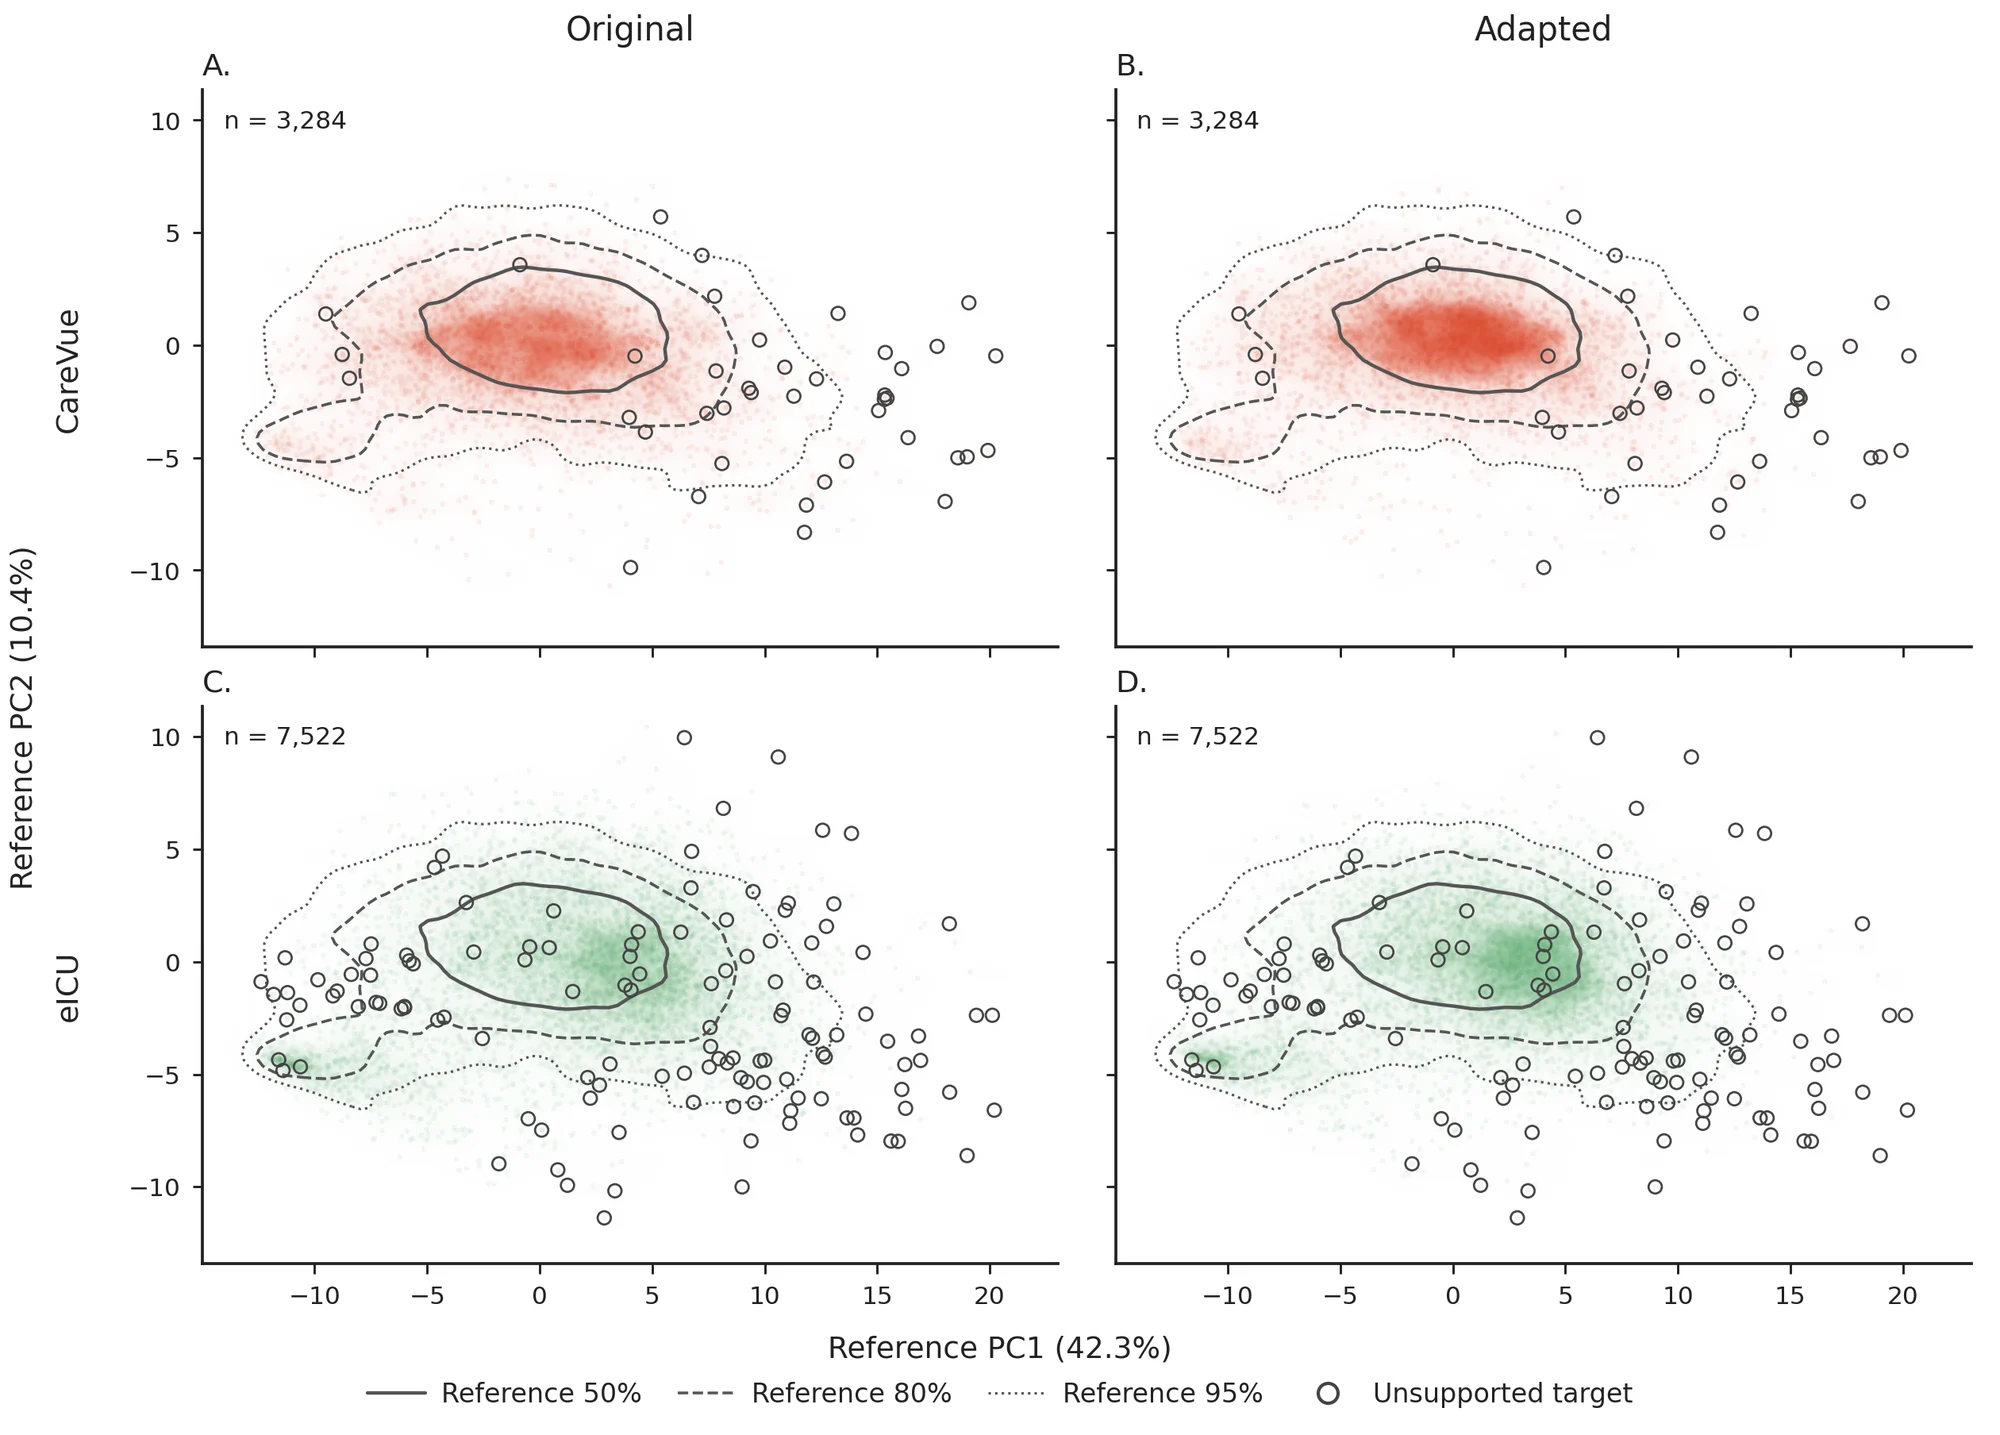
Four density panels of CareVue and eICU embeddings on MIMIC-IV principal-component axes before and after transport, with reference contours and open circles for unsupported patients.
Fig. 5. Original and adapted temporal representations on MIMIC-IV training principal-component axes. Contours enclose approximately 50%, 80%, and 95% of the reference training density.
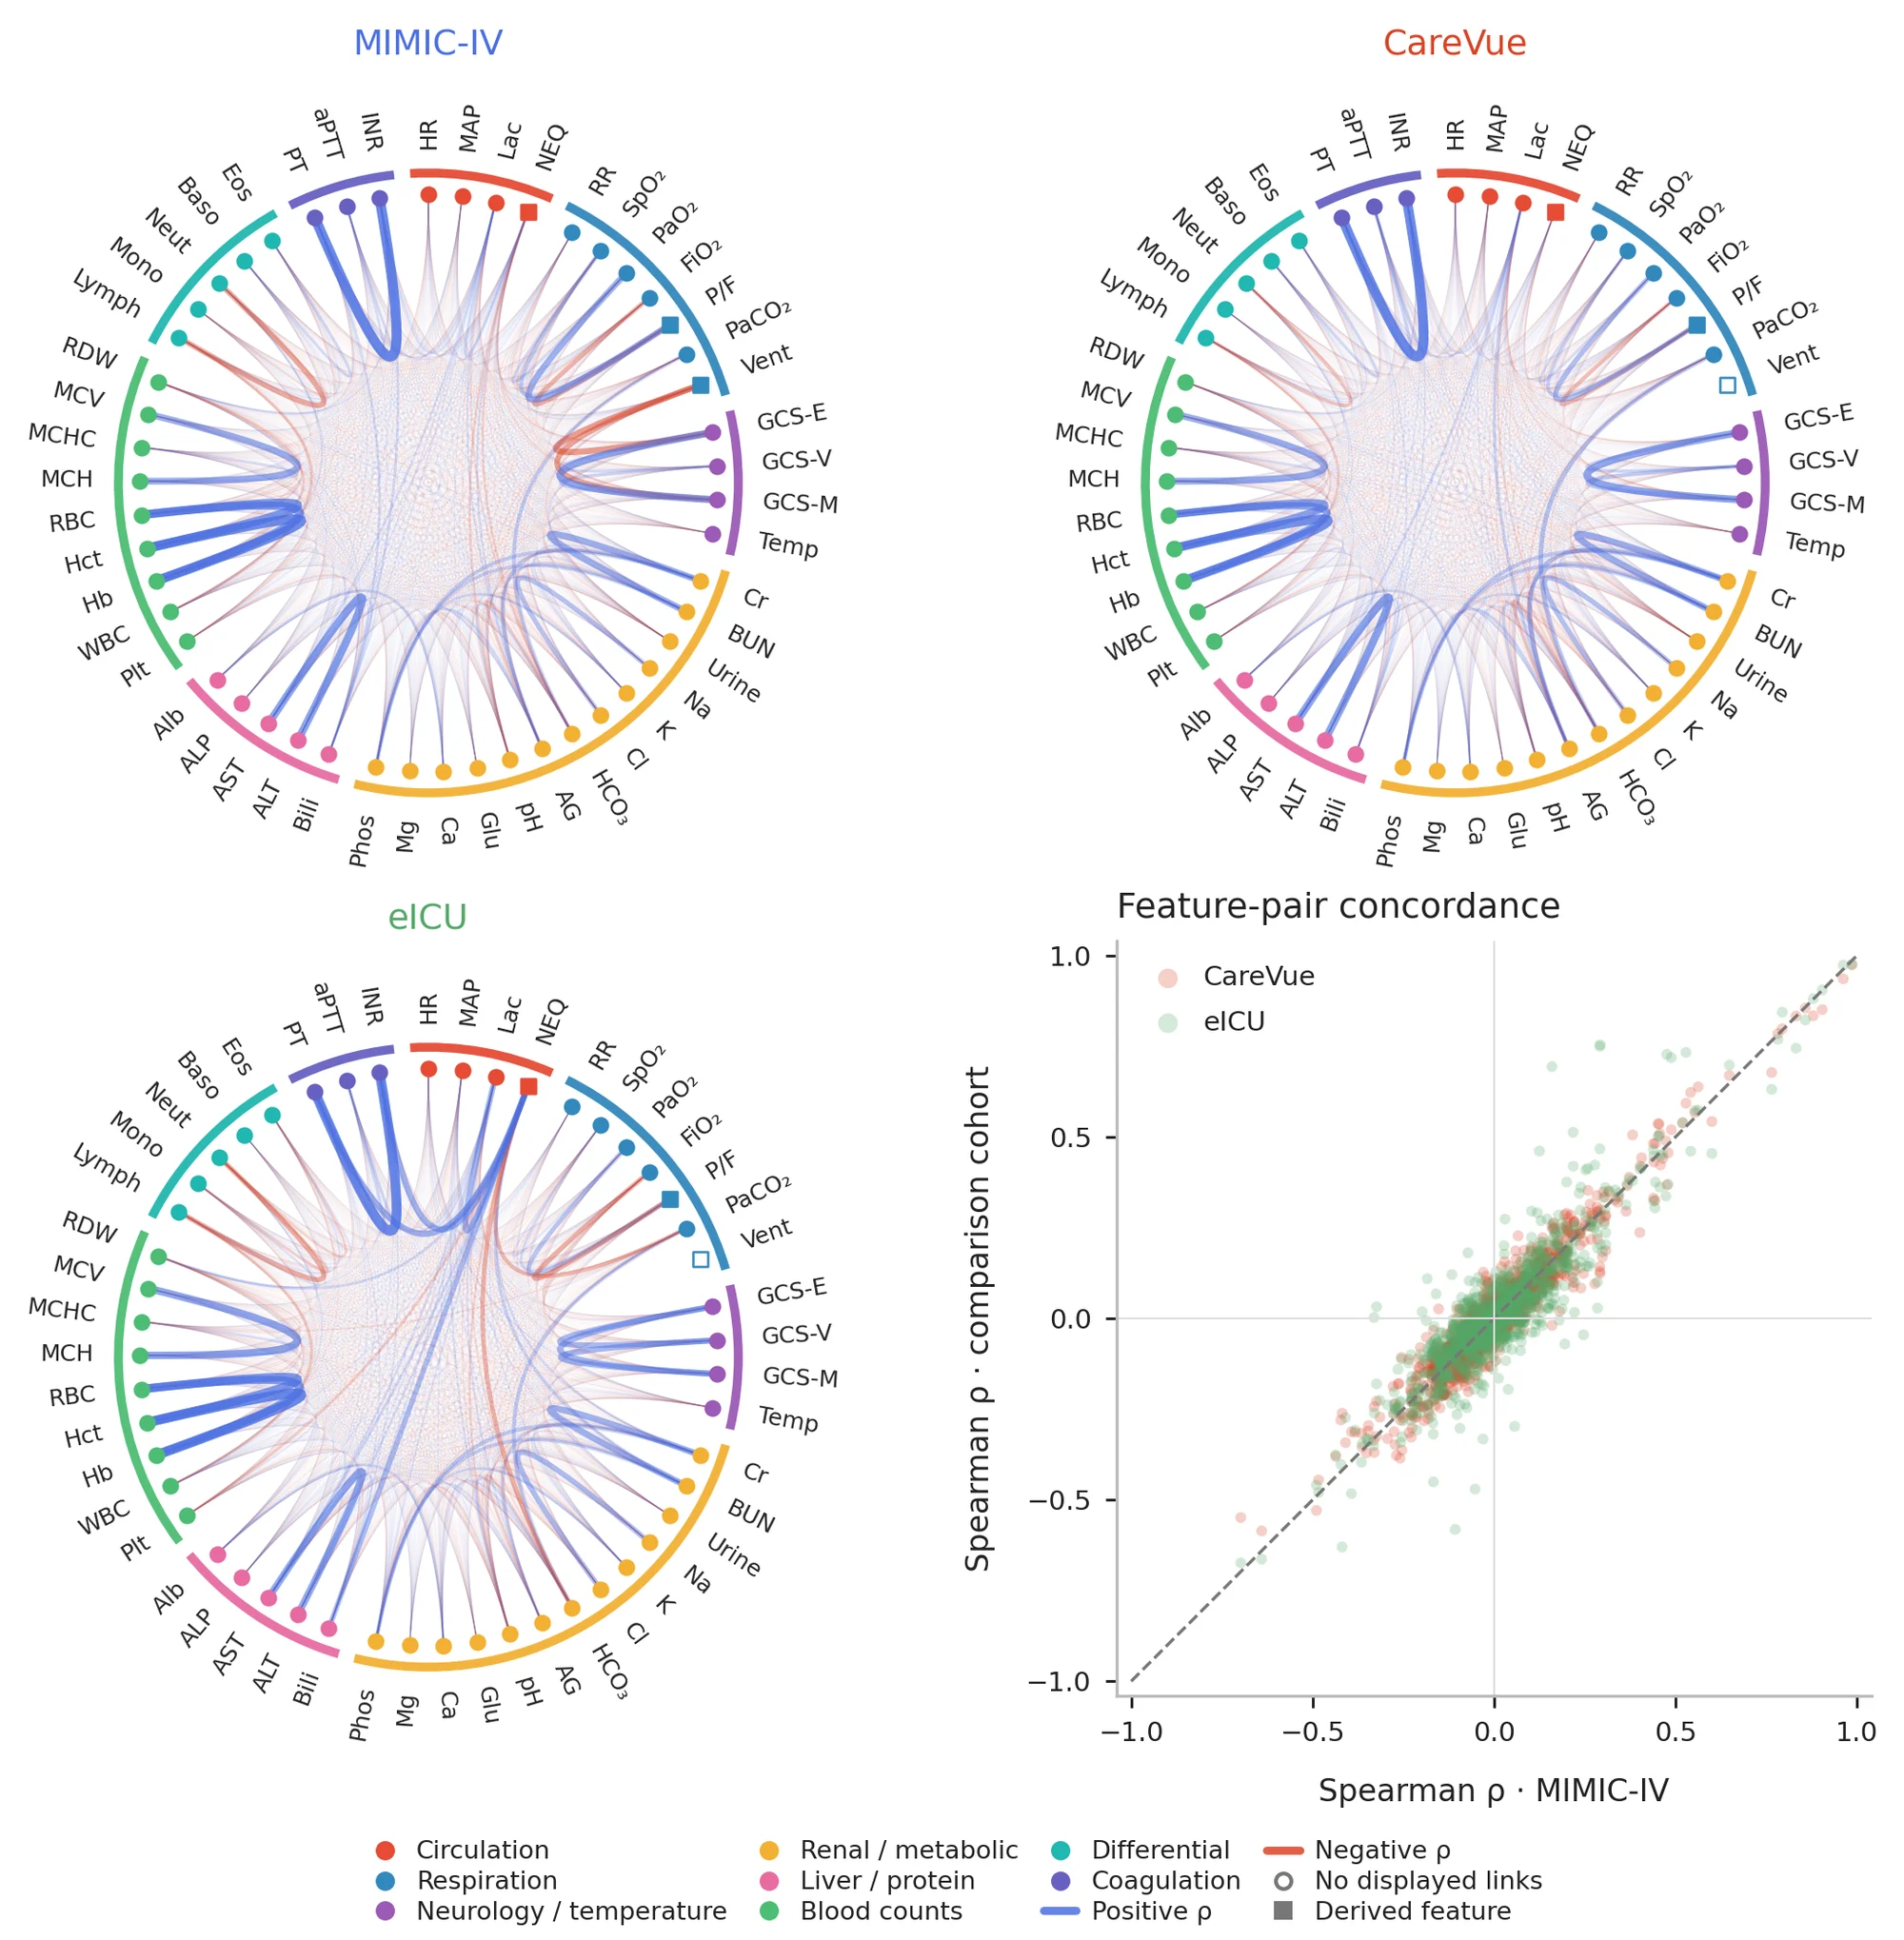
Three circular correlation diagrams of 50 clinical features, one per database, and a scatter plot comparing feature-pair correlations with MIMIC-IV.
Fig. 6. Observed clinical feature relationships. Spearman correlations between patient-level mean observed values in each database, and their concordance with MIMIC-IV.