Skip to content
PublishedArtificial Intelligence in Emergency Medicine 4 (2026) 100035 · Sole author

36-gene blood transcriptomic signature

Captures intrinsic mortality risk in early sepsis

Overview

A machine learning framework trained on SepsisTensor v1 and restricted to patients with confirmed sepsis and to gene expression alone, without severity scores or demographics. Differential expression, cross-cohort consistency filtering, and XGBoost-based recursive feature elimination selected 36 genes.

The external cohort was kept out of harmonization, feature selection, calibration, and threshold selection. Discrimination there was modest, and the study presents the panel as a molecular baseline for multimodal models rather than a standalone clinical tool.

ComBat harmonization · RFECV · XGBoost · SHAP · Isotonic calibration · Bootstrap inference

Patients
1,636 from seven GEO cohorts
Internal AUROC
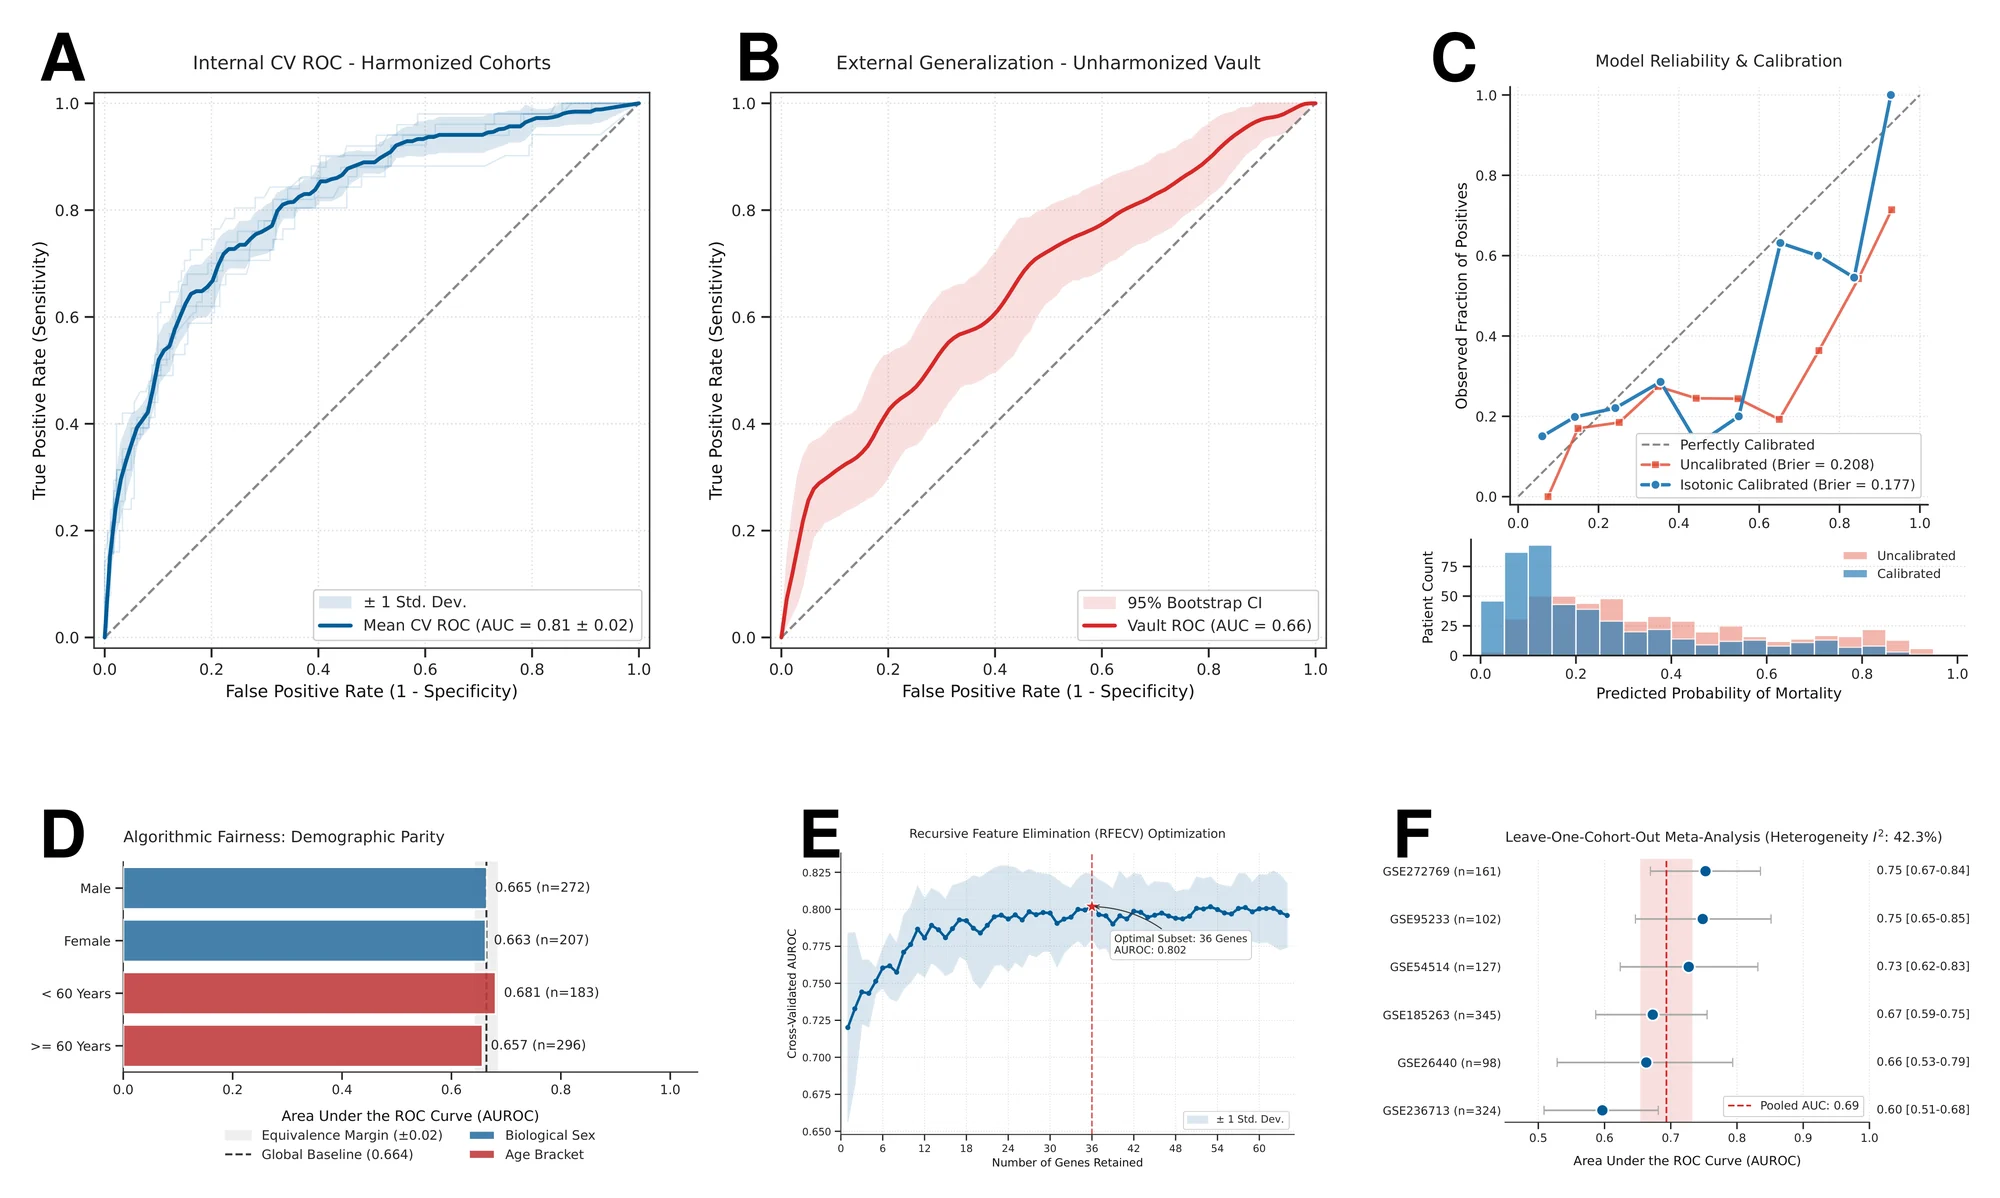
0.81 ± 0.02 (five-fold CV)
External AUROC
0.66 (95% CI 0.60–0.72)
Leave-one-cohort-out
Pooled AUROC 0.69, I² = 42.3%
External Brier score
0.208 → 0.177 after isotonic calibration

Figures
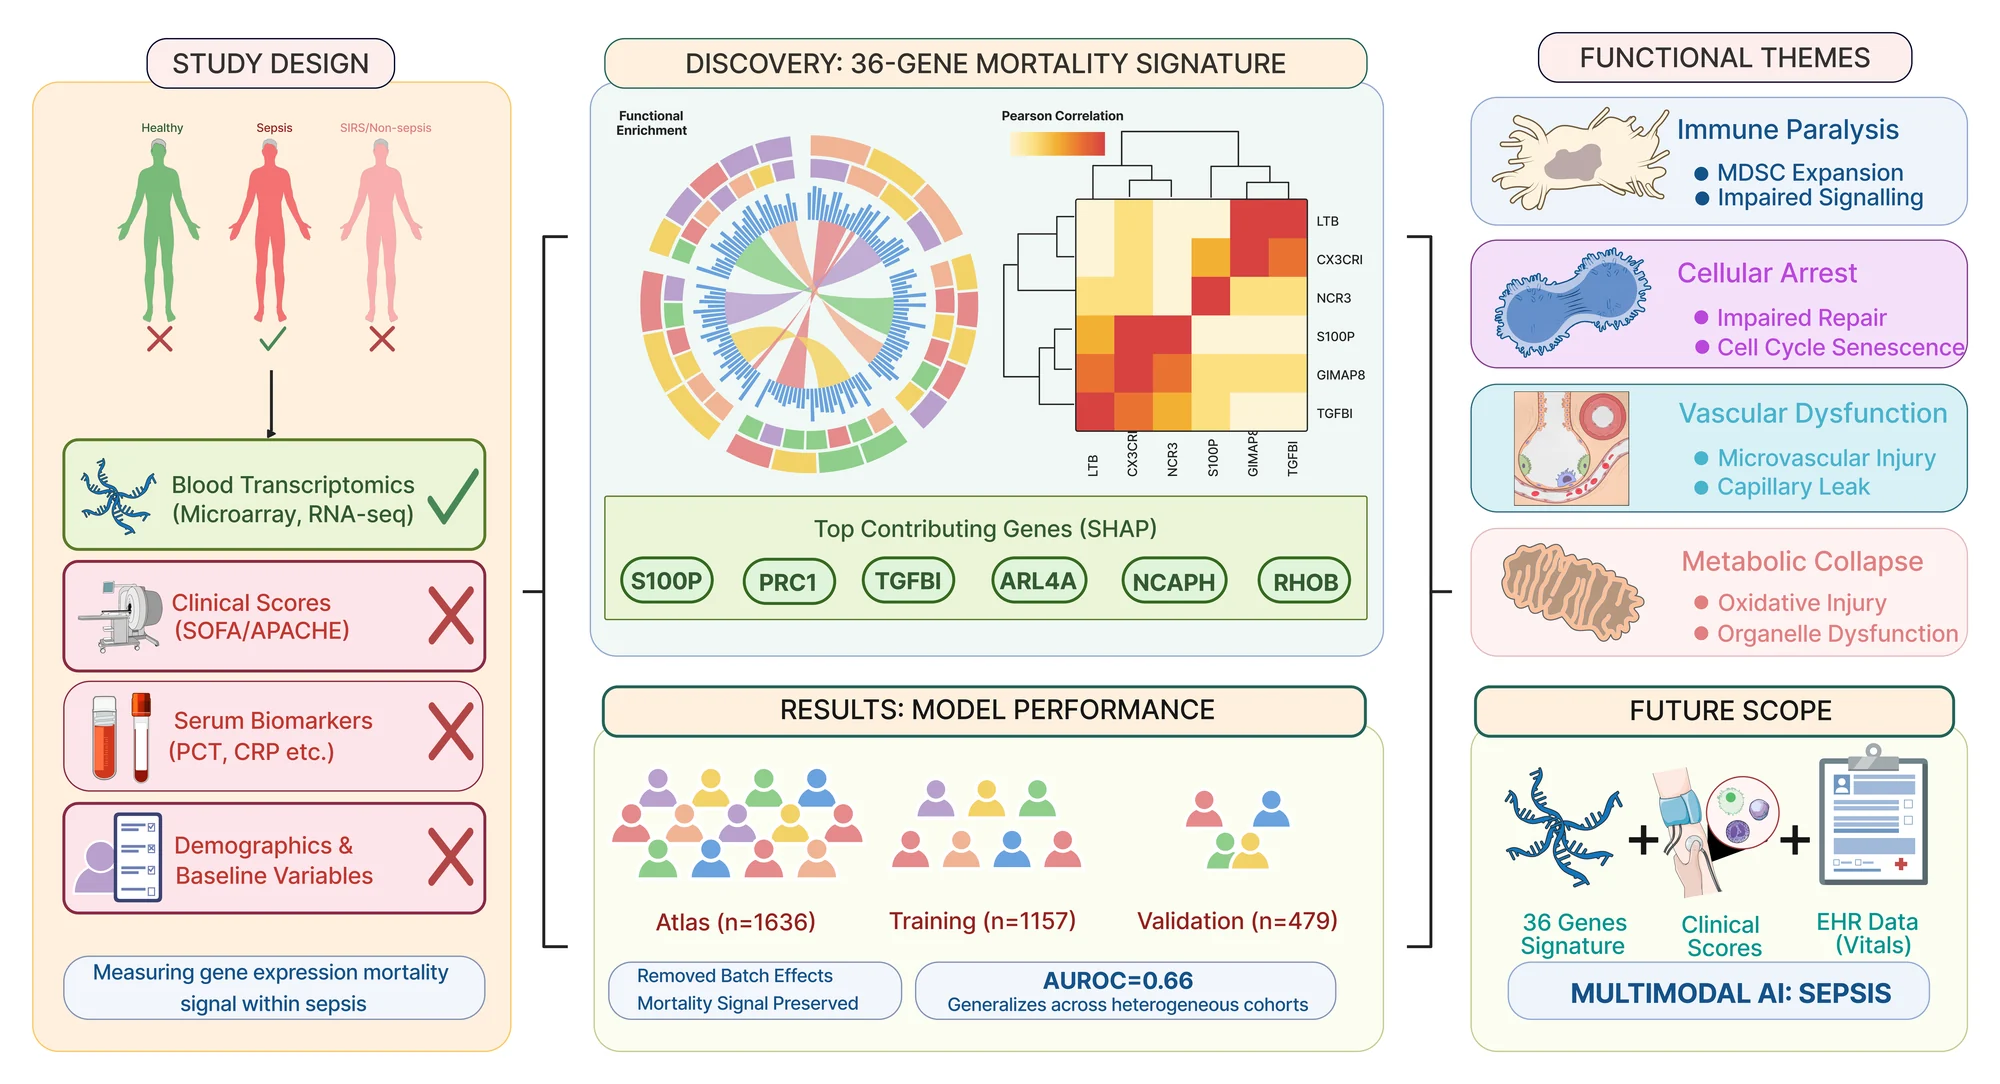
Graphical abstract with panels for study design, the 36-gene mortality signature, model performance, functional themes, and future scope.
Graphical abstract. Study design, discovery of the 36-gene signature, model performance, functional themes, and future scope.
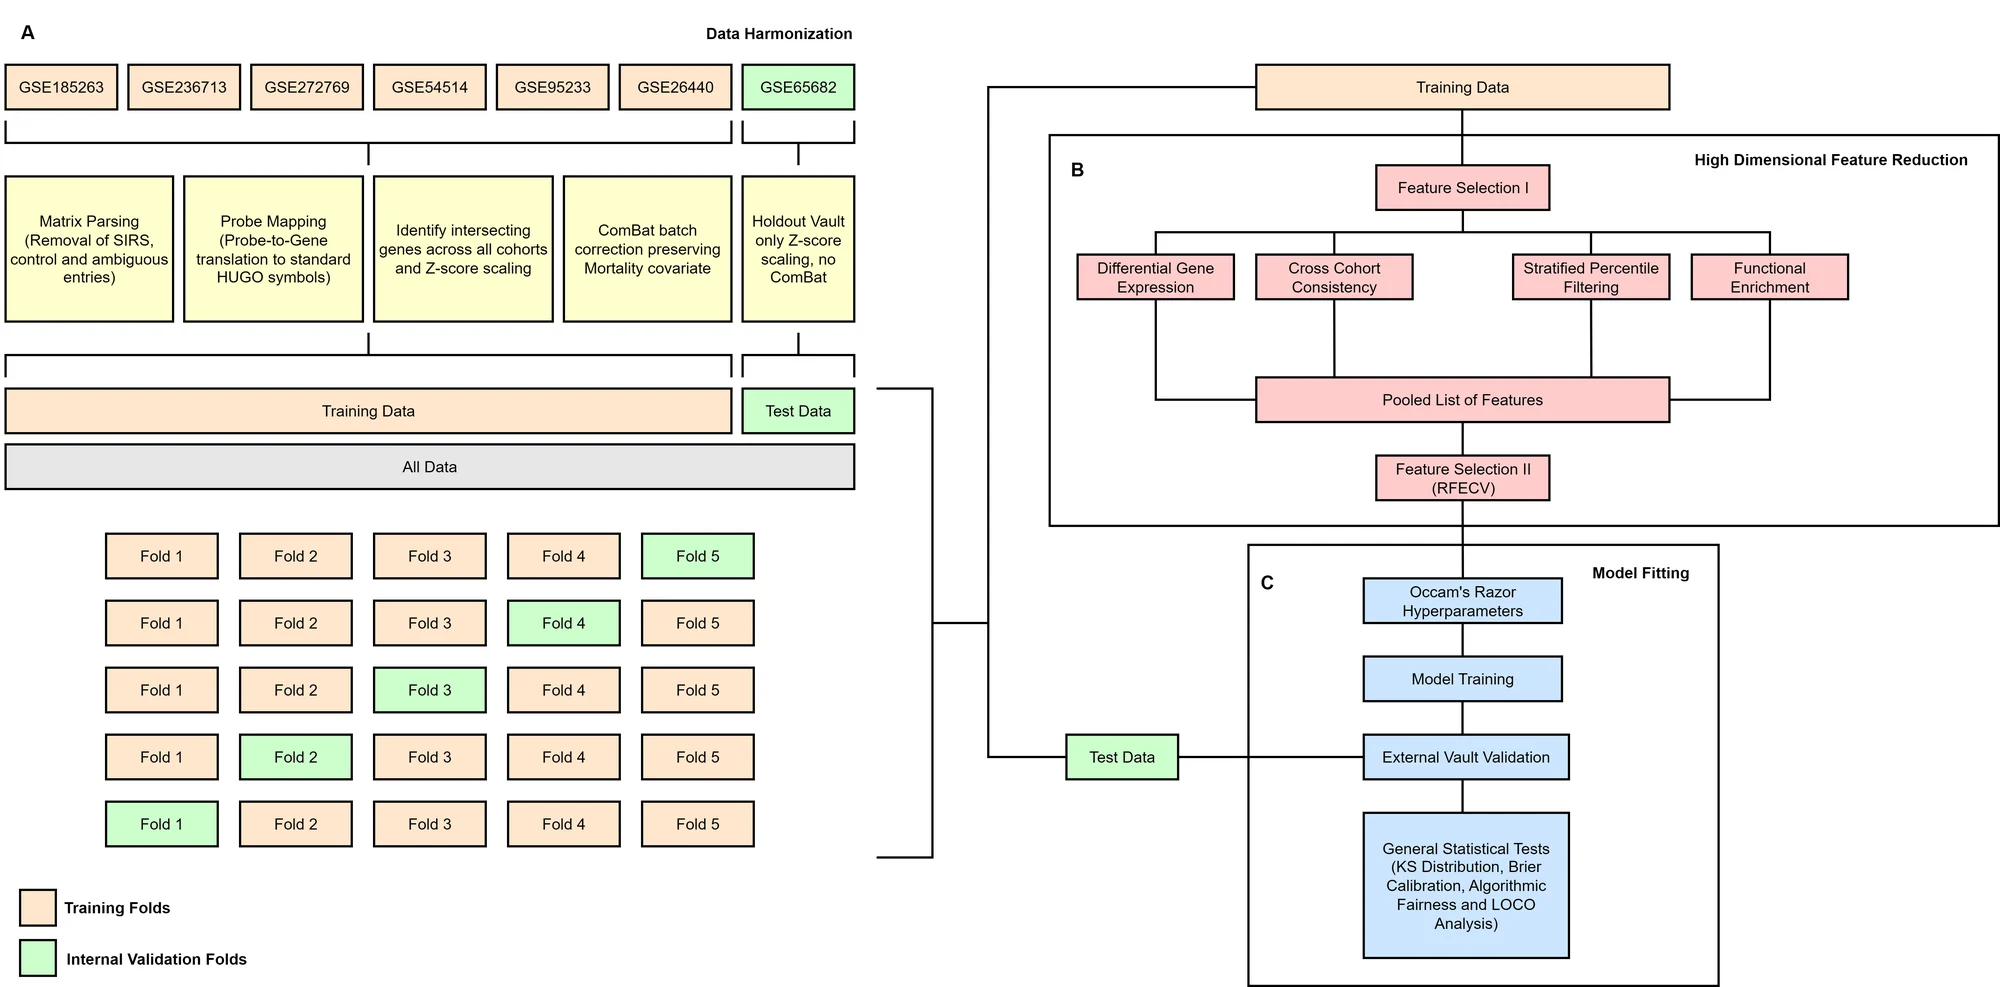
Workflow diagram: seven GEO cohorts harmonized into training data and a held-out test cohort, feature selection, and model fitting with external validation.
Fig. 1. Study workflow: data harmonization with a separately processed holdout cohort (A), high-dimensional feature reduction (B), and model fitting and evaluation (C).
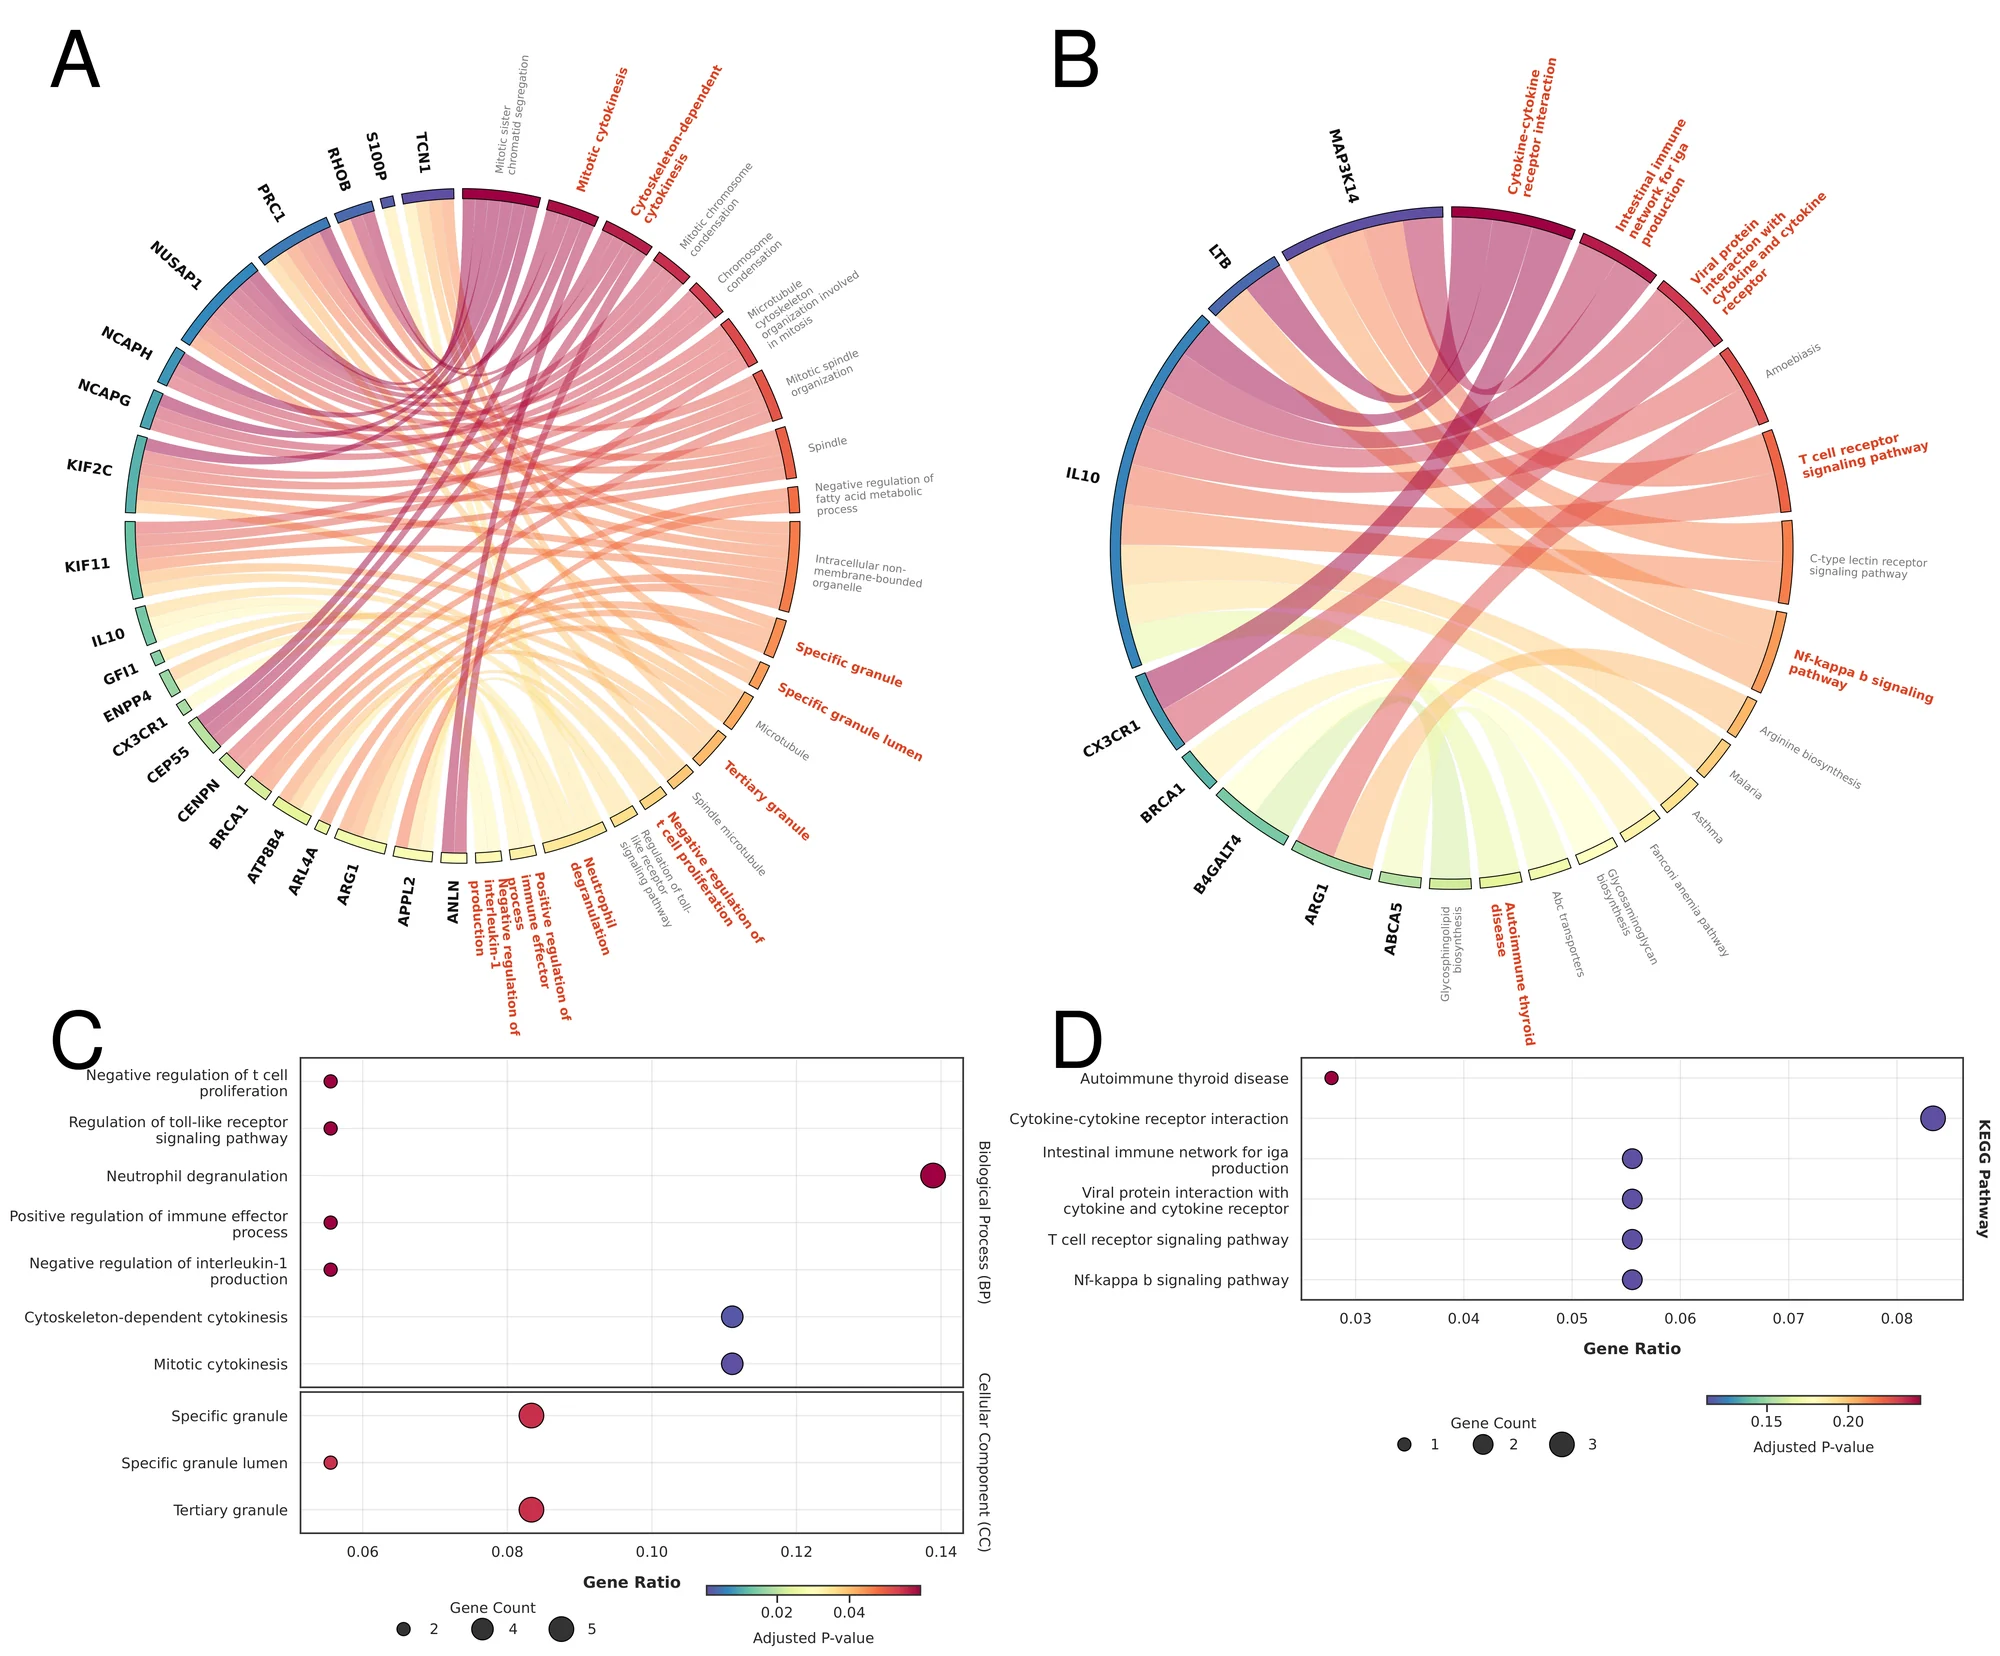
Chord diagrams linking selected genes to enriched GO terms and KEGG pathways, and dot plots of enriched terms.
Fig. 4. Functional enrichment of the 36-gene signature: GO and KEGG chord diagrams (A, B) and dot plots ranked by gene ratio and adjusted significance (C, D).
Six panels: internal and external ROC curves, calibration curves, subgroup AUROC by sex and age, the RFECV trajectory, and a leave-one-cohort-out forest plot.
Fig. 7. Internal and external evaluation, calibration, subgroup performance, feature-elimination trajectory, and leave-one-cohort-out analysis.