Skip to content

Sepsis research · Clinical data science

Priyanshu Kumar

I study sepsis using blood transcriptomic and critical-care data. My work covers multi-cohort harmonization, Sepsis-3 cohort construction, temporal reconstruction of clinical measurements, and mortality modeling with external validation.

The aim is to connect patient-level biological and clinical findings to population-level patterns of sepsis burden.

B.E. Biotechnology, Chandigarh University, Punjab, India

  1. Observed
  2. Training mask
  3. Reconstruction
  4. Imputation
  • Observed
  • Hidden target
  • SAITS
  • Forward fill
  • Median
  • Unfilled
  • After follow-up

Gap-aware SAITS on a synthetic patient. In training, observed hours are hidden by a point, 6-hour block, or whole-channel mask and then reconstructed, and only those hidden targets are scored. In the released data, only naturally missing hours within follow-up are filled, each feature by its selected method; hours after follow-up and observed-only channels stay empty. Values and reconstructions are schematic.

Global context

Sepsis-related mortality, 2017

Age-standardized deaths per 100,000 population, both sexes, all underlying causes

Burden was highest in sub-Saharan Africa, Oceania, south Asia, east Asia, and southeast Asia.

Deaths per 100,000No separate estimate
sepsis-related deaths worldwide

11.0 million

sepsis-related deaths worldwide

95% UI 10.1–12.0

of all deaths globally

19.7%

of all deaths globally

95% UI 18.2–21.4

incident cases of sepsis

48.9 million

incident cases of sepsis

95% UI 38.9–62.9

decline in age-standardized mortality, 1990–2017

52.8%

decline in age-standardized mortality, 1990–2017

95% UI 47.7–57.5

Source: Rudd KE, Johnson SC, Agesa KM, et al. Global, regional, and national sepsis incidence and mortality, 1990–2017: analysis for the Global Burden of Disease Study. Lancet 2020; 395: 200–11. doi:10.1016/S0140-6736(19)32989-7. Licensed CC BY 4.0. Country estimates from the article’s supplementary eTable 11, redrawn for this site. Boundaries from Natural Earth; they imply no position on territorial claims. Data (CSV) · Build script

A.Research program

Each project builds a documented resource first and models it second. The transcriptomic study asked how much mortality signal blood gene expression carries on its own; its conclusion called for models that add clinical data, which led to the critical-care resource. The next steps move from patients toward populations.

  1. 1. MolecularPublished

    Blood transcriptomics

    • SepsisTensor v1: seven GEO cohorts, 1,636 patients, 7,964 harmonized genes
    • 36-gene mortality signature with a fully separate external cohort
  2. 2. ClinicalSubmitted

    Critical-care time series

    • ClinicalTensorSepsis: 28,169 adult ICU stays from three databases
    • 50 features in 24 onset-aligned hourly bins with per-cell provenance
  3. 3. PatientOngoing

    Prediction and phenotyping

    • Cross-database mortality prediction, calibration, and external validation
    • Trajectory analysis, phenotyping, and risk stratification
    • How cohort differences, measurement patterns, and missing data affect transport
  4. 4. PopulationPlanned

    Sepsis burden

    • Demographic and geographic variation
    • Temporal trends and burden estimation
    • Epidemiological and health-metrics methods

B.Selected work

SubmittedScientific Data, Data Descriptor · 2026 · Sole author

ClinicalTensorSepsis

A harmonized multi-cohort temporal resource for Sepsis-3 research

Adult Sepsis-3 cohorts built from three critical-care databases through separate, source-specific pipelines and mapped to a common representation only where the source data support it. Differences in infection definitions, timing, and measurement evidence are kept visible rather than treated as equivalent.

Observed and reconstructed values are released separately. Hours after follow-up are distinguished from missing data, and every cell records whether it was observed, reconstructed by SAITS, forward filled, median filled, or left unfilled. A cross-database representation aligns CareVue and eICU to MIMIC-IV using clinically constrained optimal transport.

ICU stays
28,169
Sources
MIMIC-IV 3.1 · MIMIC-III CareVue 1.4 · eICU-CRD 2.0
Temporal grid
50 features × 24 onset-aligned hours
Release
Submitted to PhysioNet; code on GitHub
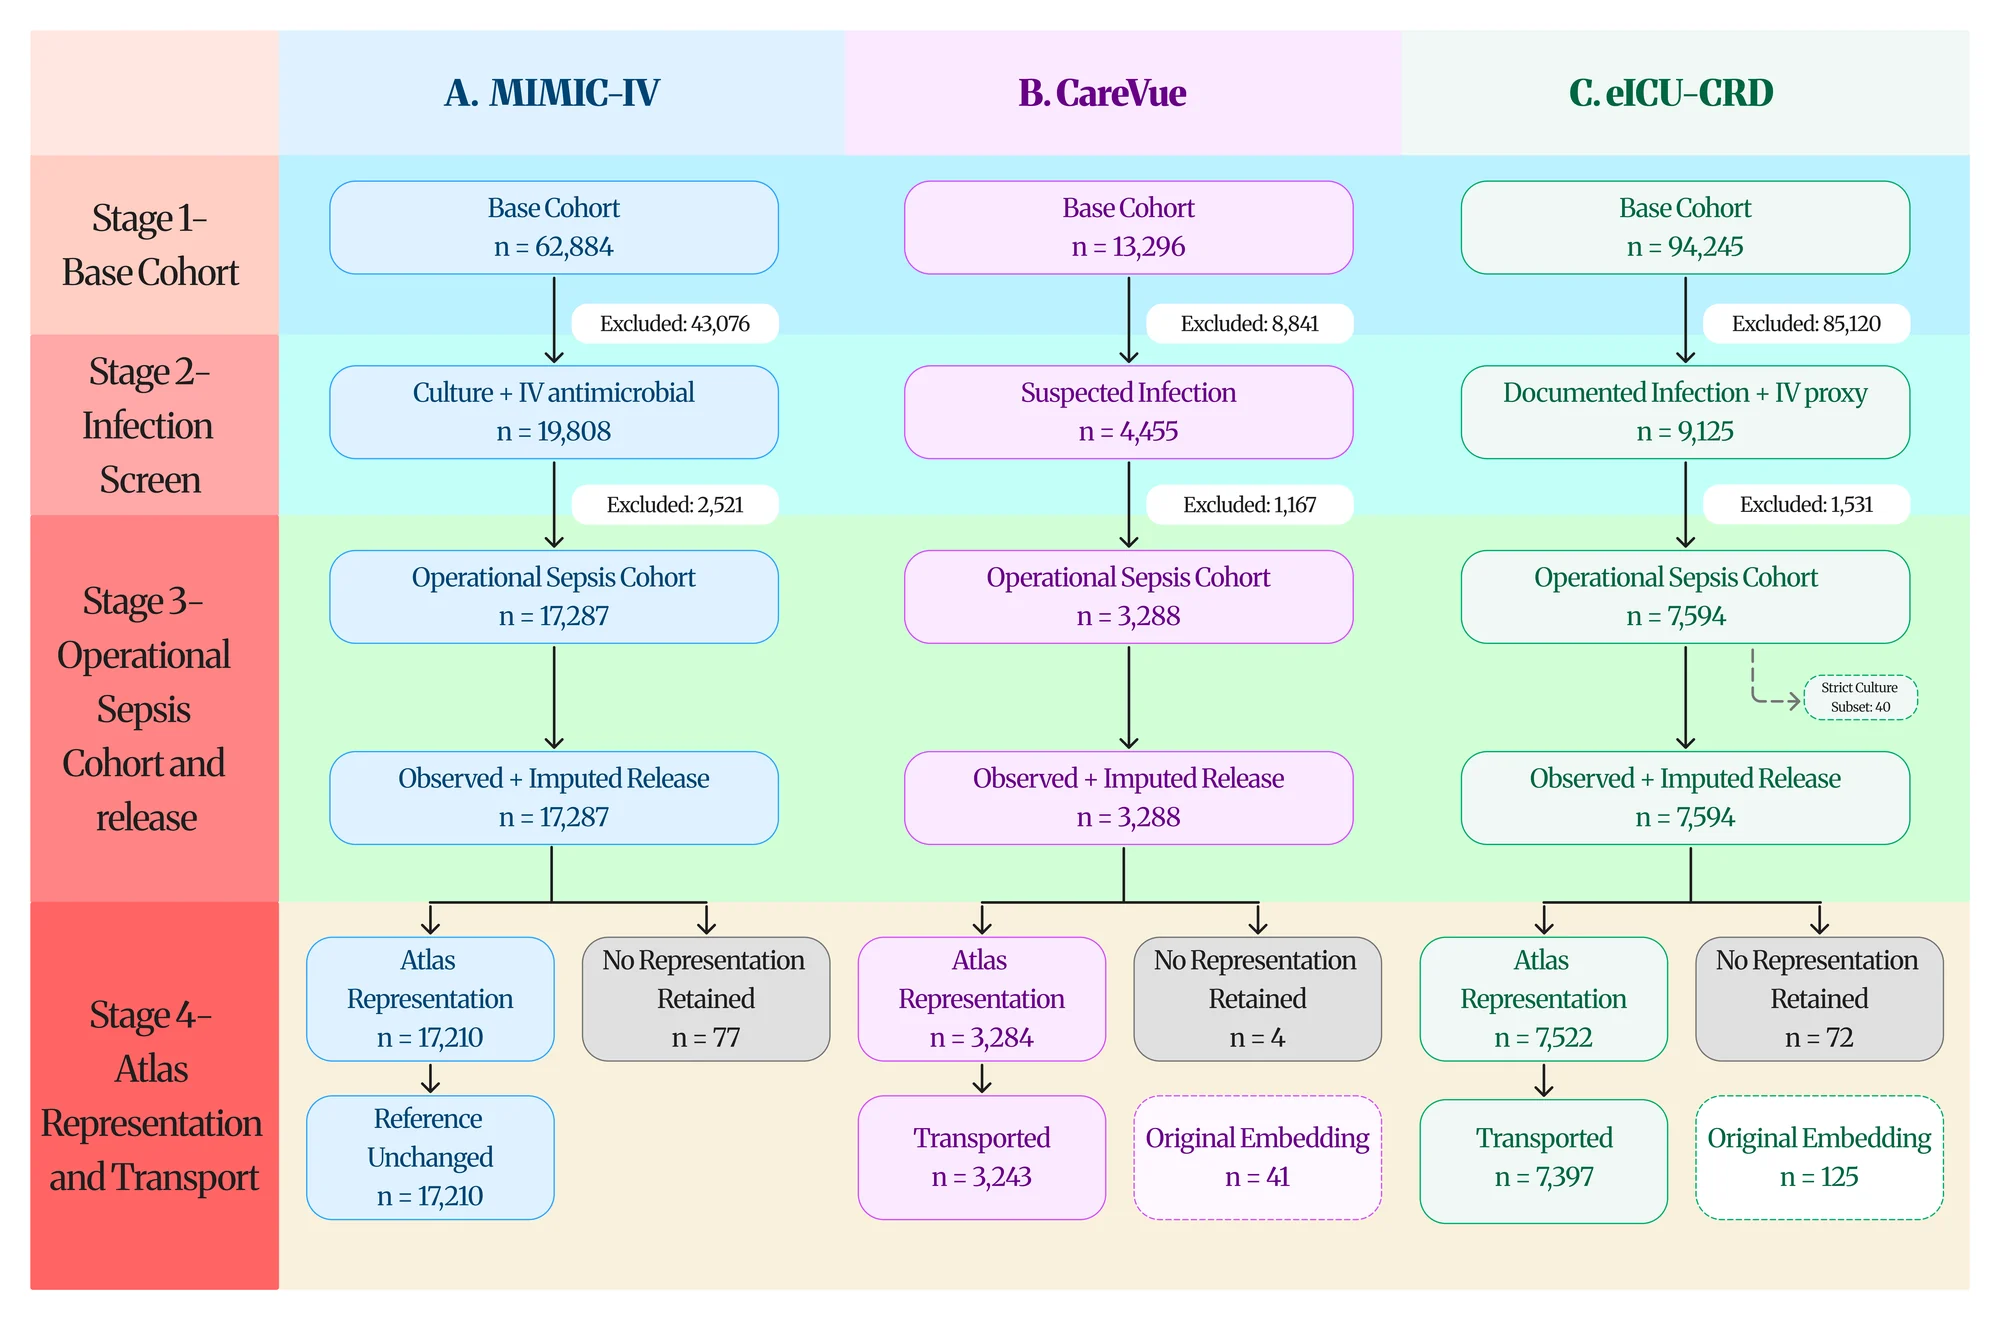
Flow diagram in three columns for MIMIC-IV, CareVue, and eICU-CRD, showing patient counts from base cohort through infection screening, operational Sepsis-3 cohort, release, and atlas representation.
Fig. 1. Cohort selection and representation retention. Each database is followed from base-cohort selection through infection screening, Sepsis-3 adjudication, temporal release, and atlas construction.
PublishedArtificial Intelligence in Emergency Medicine 4 (2026) 100035 · Sole author

36-gene blood transcriptomic signature

Captures intrinsic mortality risk in early sepsis

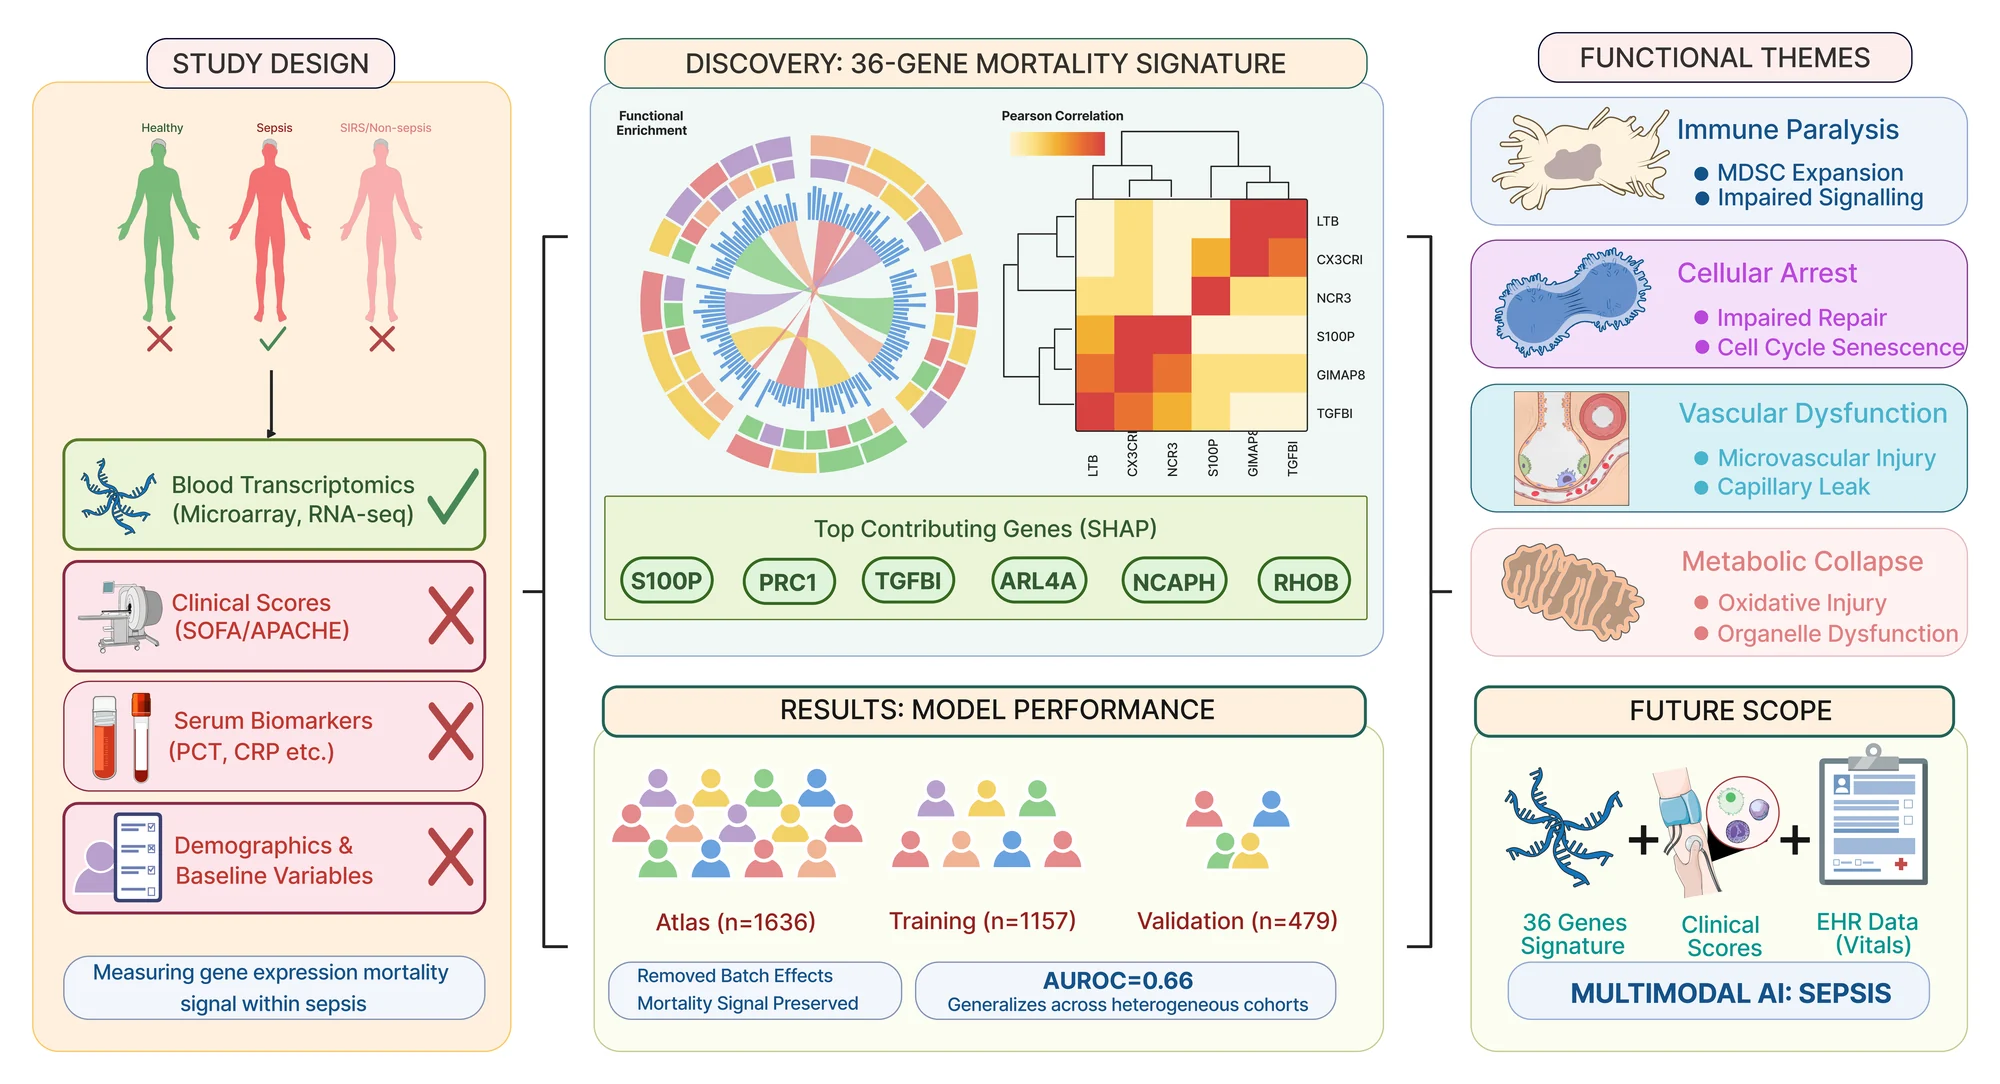
A machine learning framework trained on SepsisTensor v1 and restricted to patients with confirmed sepsis and to gene expression alone, without severity scores or demographics. Differential expression, cross-cohort consistency filtering, and XGBoost-based recursive feature elimination selected 36 genes.

The external cohort was kept out of harmonization, feature selection, calibration, and threshold selection. Discrimination there was modest, and the study presents the panel as a molecular baseline for multimodal models rather than a standalone clinical tool.

Patients
1,636 from seven GEO cohorts
Internal AUROC
0.81 ± 0.02 (five-fold CV)
External AUROC
0.66 (95% CI 0.60–0.72)
Leave-one-cohort-out
Pooled AUROC 0.69, I² = 42.3%
External Brier score
0.208 → 0.177 after isotonic calibration
Graphical abstract with panels for study design, the 36-gene mortality signature, model performance, functional themes, and future scope.
Graphical abstract. Study design, discovery of the 36-gene signature, model performance, functional themes, and future scope.
ReleasedZenodo · Version 1.0 · May 2026

SepsisTensor v1

A harmonized multi-cohort transcriptomic resource for mortality prediction

Seven public sepsis cohorts covering 1,636 patients across microarray and RNA-seq platforms, combined into a shared 7,964-gene matrix using identifier mapping, cohort-wise standardization, and ComBat harmonization.

C.Publications

Articles

  1. Kumar P. 36-gene blood transcriptomic signature captures intrinsic mortality risk in early sepsis. Artificial Intelligence in Emergency Medicine. 2026; 4: 100035.

    Published
  2. Kumar P. ClinicalTensorSepsis: a harmonized multi-cohort temporal resource for Sepsis-3 research. Scientific Data. Data Descriptor, submitted 2026.

    Submitted
  3. Kumar P, Singh G, Kaur S, Sharma P. Computational study of structural and functional effects of EGFR nsSNPs and ncSNPs in glioblastoma. Computers in Biology and Medicine. Under review, 2026.

    Under review

Datasets

  1. Kumar P. SepsisTensor v1: a harmonized multi-cohort transcriptomic resource for mortality prediction. Zenodo. Version 1.0, 2026.

    Released

ORCID 0009-0004-1576-027X

D.Methods and tools

Clinical data

  • MIMIC-IV, MIMIC-III, eICU-CRD
  • Sepsis-3 cohort construction
  • Temporal alignment
  • Measurement harmonization
  • Provenance tracking
  • Cross-database distribution shift

Statistics and validation

  • Hypothesis testing
  • Bootstrap inference
  • Calibration analysis
  • External validation
  • Missing-data analysis
  • PCA, PHATE

Machine learning

  • Temporal representation learning
  • SAITS
  • Dynamic time warping
  • Optimal transport
  • SHAP
  • scikit-learn, XGBoost, PyTorch

Computational biology

  • Transcriptomics
  • GEO
  • Gene-expression harmonization
  • Differential expression
  • Functional enrichment
  • Biopython

Scientific visualization

  • Matplotlib
  • R / ggplot2
  • ChimeraX
  • Figma, draw.io
  • Multi-panel figures
  • Scientific schematics

Programming and environments

  • Python
  • Bash
  • pandas, NumPy
  • Jupyter
  • Docker
  • Git, GitHub

Molecular modeling

  • Molecular dynamics
  • GROMACS
  • AutoDock Vina
  • HADDOCK3
  • PyMOL

E.About

I am an undergraduate in Biotechnology Engineering at Chandigarh University. My research uses public transcriptomic and critical-care data to study sepsis outcomes, and I am the sole author of a published transcriptomic mortality signature and of a multi-database clinical resource submitted to Scientific Data.

I also work in structural bioinformatics, including molecular dynamics of disease-associated variants. I intend to extend the sepsis work toward population-level epidemiology and health metrics, and I welcome correspondence about related research.

Working practice

  • Code, environments, and records are released with each project: version-controlled pipelines, Docker images with pinned dependencies, cohort-flow records, data dictionaries, and validation outputs.
  • External cohorts and test partitions are fixed before harmonization, feature selection, calibration, or imputation-rule selection.
  • Estimates are reported with their uncertainty: bootstrap intervals, calibration, subgroup analyses, and leave-one-cohort-out validation.
  • All analyses run on a 4-core, 8 GB workstation with a 4 GB GPU. Reproducing them does not require high-performance computing.

Education

  • Aug 2024 – Jul 2028

    Bachelor of Engineering in Biotechnology

    Chandigarh University, Punjab, India

    CGPA 8.24 / 10

Research experience

  • May – Jun 2026

    Research Intern

    Institute of Bioinformatics and Applied Biotechnology (IBAB), Bengaluru

    Molecular dynamics study of mutation-related structural changes in eye lens proteins. Supervisor: Prof. Jayashree Nagesh.

Certification

  • Jan – Apr 2026

    NPTEL Structural Biology

    Elite + Silver